February 28 started like most late-winter trading sessions — unremarkable. Bitcoin was hovering around $66,000, gold had already posted new all-time highs above $5,270, and the Federal Reserve had signaled it would hold rates steady through the first half of the year. Then the news broke. The United States and Israel launched coordinated strikes against Iran, and within minutes over $128 billion in crypto market value evaporated.
The initial reaction was textbook: gold surged, the dollar strengthened, equities fell, and Bitcoin dropped toward $63,106. Every reflex in the market pointed to the same read — Bitcoin is a risk asset, not a safe haven. By March 13, that read was looking badly wrong.
The First Two Weeks: Bitcoin Outperforms Everything
As of March 13, Bitcoin had climbed to $72,770 — up roughly 7% from its conflict-driven lows. Gold had lost about 2%, sliding from approximately $5,270 to $5,170. The S&P 500 was down around 1%, and the Nasdaq had shed half a point. Bitcoin, the asset that panic-sold first, had outperformed every major asset class in the period that followed.
Arthur Hayes captured the inversion cleanly in a March 12 post: Bitcoin had simply outperformed everything else since the conflict began. That kind of statement would have seemed absurd during the opening hours of the crisis, when crypto traders were scrambling to de-risk.
| Asset | Feb 28 Low | Mar 13 | Change |
|---|---|---|---|
| Bitcoin (BTC) | $63,106 | $72,770 | +7.0% |
| Gold (XAU) | ~$5,270 | ~$5,170 | -2.0% |
| S&P 500 | — | — | -1.0% |
| Nasdaq 100 | — | — | -0.5% |
| Brent Crude | Pre-conflict | ~$115/bbl | +15% |
Asset performance: Feb 28 conflict start through Mar 13, 2026
Asset performance: Feb 28 conflict start through Mar 13, 2026
The Correlation That Wasn’t Supposed to Happen
What made March unusual wasn’t just the price recovery — it was the correlation shift. Wintermute’s Bryan Tan described the arc precisely: during the initial conflict phase, Bitcoin fell while gold rallied. A textbook risk-off response. But within days, both assets began rising together as the dollar weakened. The BTC-gold correlation shifted from -0.49 to +0.16 in a matter of days, a statistically significant regime change that hadn’t appeared during any prior geopolitical crisis.
Macro strategist Luke Gromen, in an interview published March 9, described what he observed as genuinely new behavior: “Normally Bitcoin is fully risk, or at least it has been, and in this case it was actually acting as risk off.” He framed it partly as a function of Bitcoin’s utility in conflict zones — the ability to move capital across borders instantly when physical infrastructure is compromised. The UAE hypothetical he raised wasn’t rhetorical; it was a real transmission mechanism being stress-tested in real time.
“The Bitcoin-gold correlation has flipped positive for the first time in weeks, suggesting the market is starting to treat Bitcoin less as a tech proxy and more as something else entirely.”
— Yevgeny Bebnev, Alaris Capital, Dubai
Academic research published in ScienceDirect had already found that Bitcoin and the Swiss franc function as stronger safe havens against geopolitically driven equity crashes than gold or Treasury bonds — specifically during large market dislocations, not moderate swings. The Iran conflict may have delivered the first major real-world data set to test that thesis outside of a backtest.
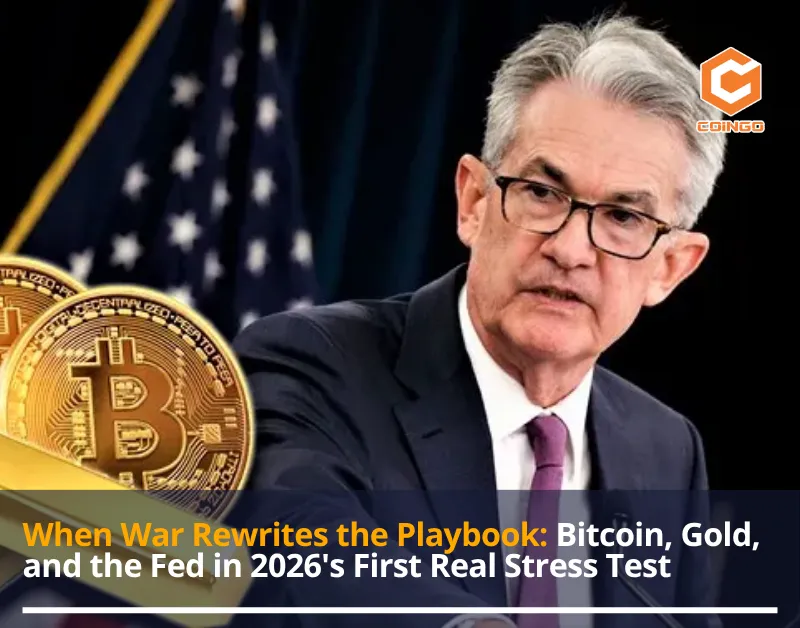
The Fed’s Impossible Position
The March 18 FOMC meeting landed against this backdrop. The committee voted 11-1 to hold the benchmark rate at 3.5%-3.75% — a decision markets had fully priced in — but the accompanying commentary carried a notably hawkish edge. Jerome Powell acknowledged that near-term inflation expectations had risen, explicitly tying this to the oil price surge driven by Strait of Hormuz supply disruptions. Policymakers raised their 2026 inflation outlook to 2.7%, citing systemic energy pressure, with Brent crude trading near $116 per barrel.
The dot plot shifted. Before the conflict, markets had been pricing two rate cuts in 2026. After March 18, the median expectation had dropped to one — and the probability of a rate hike, something almost nobody was modeling in January, had jumped on Polymarket from 8% to 22%. Bitcoin fell roughly 5% following the press conference, testing $71,100 as institutional de-risking triggered a $708 million single-day ETF outflow.
Chicago Fed President Austan Goolsbee framed the fork in the road clearly: multiple cuts if inflation stays controlled; hikes if energy costs spiral and feed through to core prices. The Fed isn’t forecasting inflation — it’s watching two scenarios simultaneously and won’t commit to either until the data forces the issue. Adding another variable: Powell’s term expires May 15, and Kevin Warsh — Trump’s nominated successor — has signaled a preference for lower rates, though he’s made no recent public statements indicating his current positioning.
| Scenario | Fed Path | Crypto Impact |
|---|---|---|
| Conflict de-escalates | 1 cut in 2026 | Moderately bullish |
| Oil stays elevated | Hold all year | Range-bound pressure |
| Inflation spirals | Rate hike (22% prob.) | Sharp sell-off risk |
Fed scenario matrix: paths and crypto implications as of March 25, 2026
Fed scenario matrix: paths and crypto implications as of March 25, 2026
Oil Is the Variable No One Can Model
Jake Ostrovskis, Head of OTC at Wintermute, put it directly: the oil move matters more for crypto than the geopolitics itself. That’s counterintuitive until you trace the transmission mechanism. Elevated oil prices → higher headline inflation → Fed holds or hikes → dollar strengthens → risk assets face headwinds → Bitcoin sells with equities. The Strait of Hormuz isn’t just a shipping lane; it’s a monetary policy lever that the Fed doesn’t control.
Iran laid mines in the strait following the initial strikes. Brent crude briefly touched $115 per barrel. That single event changed the terminal rate calculation for the entire year. If oil normalizes — as it began to on March 23, when Trump signaled de-escalation talks were underway and crude dropped sharply — the rate path opens back up. If it stays elevated, the Fed is effectively trapped: hold and risk inflation expectations becoming unanchored, hike and risk a hard landing in an economy already showing payroll weakness.
“Depending on the circumstances, we may have to raise interest rates.”
— Austan Goolsbee, Chicago Federal Reserve President, March 2026
What Gold’s Correction Tells Us
Gold’s behavior during this period is as instructive as Bitcoin’s. The metal posted its largest weekly percentage drop in over 14 years in the third week of March — despite an ongoing active military conflict. Ole Hansen at Saxo Bank explained the mechanism: prices above $5,200 had attracted heavy positioning, leaving the market vulnerable to forced selling as margin calls hit across other asset classes. When investors need liquidity fast, they sell what has gains. Gold had plenty.
Rhona O’Connell at StoneX noted the same dynamic: in extreme stress scenarios, the demand for dollar liquidity often temporarily overrides the safe-haven appeal of gold itself. This is not a new phenomenon — it happened in March 2020, it happened in parts of 2008 — but it’s a useful corrective to the narrative that gold is a clean crisis hedge. In an active shooting war, with physical delivery complicated by closed regional airports and widening spreads, the frictionless nature of Bitcoin becomes structurally relevant in ways it wasn’t in calmer markets.
The Harder Question
None of this resolves whether Bitcoin has permanently shifted its correlation regime. A two-week data set isn’t a regime change — it’s an anomaly worth watching. QCP Capital analysts draw a parallel to June 2025, when a prior U.S. strike on Iran caused Bitcoin to temporarily fall before rallying to $123,000 within weeks. Options markets appear to be pricing something similar: traders were aggressively buying March 27 call options at $74,000 and $75,000 strikes through mid-March.
What has changed is the range of plausible narratives. Bitcoin has now survived a genuine geopolitical shock — not a macro slowdown, not a regulatory crackdown, but an active military conflict with direct commodity market consequences — and finished the acute phase outperforming gold, equities, and bonds. That doesn’t make it a safe haven. But it makes the question harder to dismiss than it was on February 27.
The Fed path, oil prices, and the trajectory of the conflict will do more to determine Bitcoin’s direction over the next 90 days than any on-chain metric or technical level. Traders watching the $74,000 resistance and the $65,000 support band are reading the right chart. The inputs that will move those levels are being set in Washington, Tehran, and Houston.
Data sourced from BTC.Network, CoinDesk, Wintermute Research, QCP Capital, Federal Reserve March 2026 FOMC statement, and The National. This article is editorial analysis and does not constitute investment advice.